Lesbian Visibility Week/Day: Making abuse against lesbian & bisexual women visible: Cotton Ceiling study results
April 26 is Lesbian Visibility Day in Spain. It happens to coincide with Lesbian Visibility Week in the United Kingdom. Today, I wish to make sex related abuse against lesbians, and our bisexual sisters, visible by discussing the results of the Spanish speaking Cotton Ceiling study. The results are important, and sexual coercion and sexual harassment are issues that matter as these things can destroy women’s lives by destroying their physical health, their mental health, their economic well being, by erasing their support networks, by resulting in them being kicked out of their homes which are already consequences lesbians and bisexual women face just by coming out of the closet. There is no “Happy Lesbian Visibility Day!” here but rather the need to start a sad and depressing discussion.
The key findings include the fact that 30.9% of lesbians reported being sexually pressured by transwomen, 1.9% by transmen, 74.1% by other members of the collective and 81.8% by men. 54.7% of women said they had been sexually harassed online, with lesbians reporting a higher percentage at 65.5%. This contrasted to 3.6% being sexually harassed online by transmen and 69.1% being sexually harassed online by any other type of person including men. This percentage was higher for American women than it was for Spanish women.
The survey of Spanish speaking lesbians and bisexual women, which also included a version in English for lesbians and bisexual women living in Spanish speaking countries, was open in August 2022. The original study is long,at around 28,900 words or 107 pages. The length, and the fact that it is in English when talking about Spanish speakers, is part of the reason it has not been published academically. This study was broadly informed by the Get The L Out UK survey by Angela Wild but went further, asking forty-two questions of which thirteen had multiple parts along five axes of analysis.128 women participated.
Getting demographic details related to what lesbian populations look like is difficult. Almost every method has its flaws, from definitions to different sampling methods. As part of its literature review, this study looked at the demographic characteristics of other studies done in Spain, studies done mostly by queer feminists, and found that the population who responded to the survey broadly matched the general population characteristics in those studies; the conclusion is that the population characteristics were close enough to the demographics in those other studies to indicate reliability of the survey getting a representative sample. This was the first axis of analysis. Table 1 below shows the specific breakdown of participation related to gender identity and sexual attraction.
Table 1. Sexual attraction and orientation, and gender identity respondent totals and percentages
|
Sex based attraction |
Attraction based on gender identity |
|||||
|
Question |
Category |
Total |
Only women |
Men and women |
People who are not trans / Cis people |
Both groups |
|
Sexual orientation |
Bisexual |
73
(56.6%) |
16
(21.9%) |
57 |
64 |
9
(12.3%) |
|
Homosexual |
55 (42.6%) |
54 (98.2%) |
1 |
49 |
4 (7.5%) |
|
|
Heterosexual |
1
(100%) |
0 (0%) |
0 |
1 |
0 (0%) |
|
|
Gender Identity |
Woman / I do not have a
gender identity |
123 (95.3%) |
66 (54.1%) |
56 |
111 |
12 (9.8%) |
|
Cis |
3
(2.3%) |
2
(66.7%) |
1 |
1 |
1
(50.0%) |
|
|
I don't understand the significance
of gender identity |
3 (2.3%) |
2 (66.7%) |
1 |
2 |
0 |
|
|
Attraction based on
gender identity |
People who are not trans / Cis people |
114
(89.8%) |
63
(55.8%) |
50 |
||
|
Trans and non-binary
people |
0 |
0 |
0 |
|||
|
Both groups |
13
(10.2%) |
5
(38.5%) |
8 |
|||
Next, they looked at women’s views related to transwomen and transmen. Table 2 and Table 3, which are numbered differently in the actual study, provide an idea as to their attitudes. It found that overall, 90.7% of lesbian and bisexual women said “no, transwomen are not women and transmen are not men,” 1.6% who said “yes, transwomen are women” and “transmen are men,” 5.4% who said sometimes “transwomen are women and transmen are men,” and 1.6% who said they were uncertain. It found 91.3% women said, “transwomen cannot be lesbians,” 2.4% said “transwomen can be lesbians” and 6.3% yes but only if the transwoman had gender affirmation surgery. Lesbians were more likely to believe that transwomen could be women or were women in some contexts compared to bisexual women at 10.0% to 5.4%. This pattern remained in regard to the question whether transwomen could be lesbians or were lesbians if they had undergone gender affirmation.
This broadly matched who women would consider for potential sexual partners. For, 3.1% said they would consider having sex with a transwoman, 7.8% answered uncertainly and 89.1% answered no, they would not consider having sex with a transwoman. Attitudes towards transmen as sexual partners were a bit different, with 14.8% saying they would consider a transman for a potential sexual partner, 25.0% said they were uncertain and 60.2% saying no to having sex with a transman.
Asked about this in practice, if they had had sex with a transwoman, only three women said they had. One said she did not know beforehand and stopped once she realized the person was a transwoman as she was not told beforehand while the other two knew beforehand..
Table 2. Attitudes towards transpeople
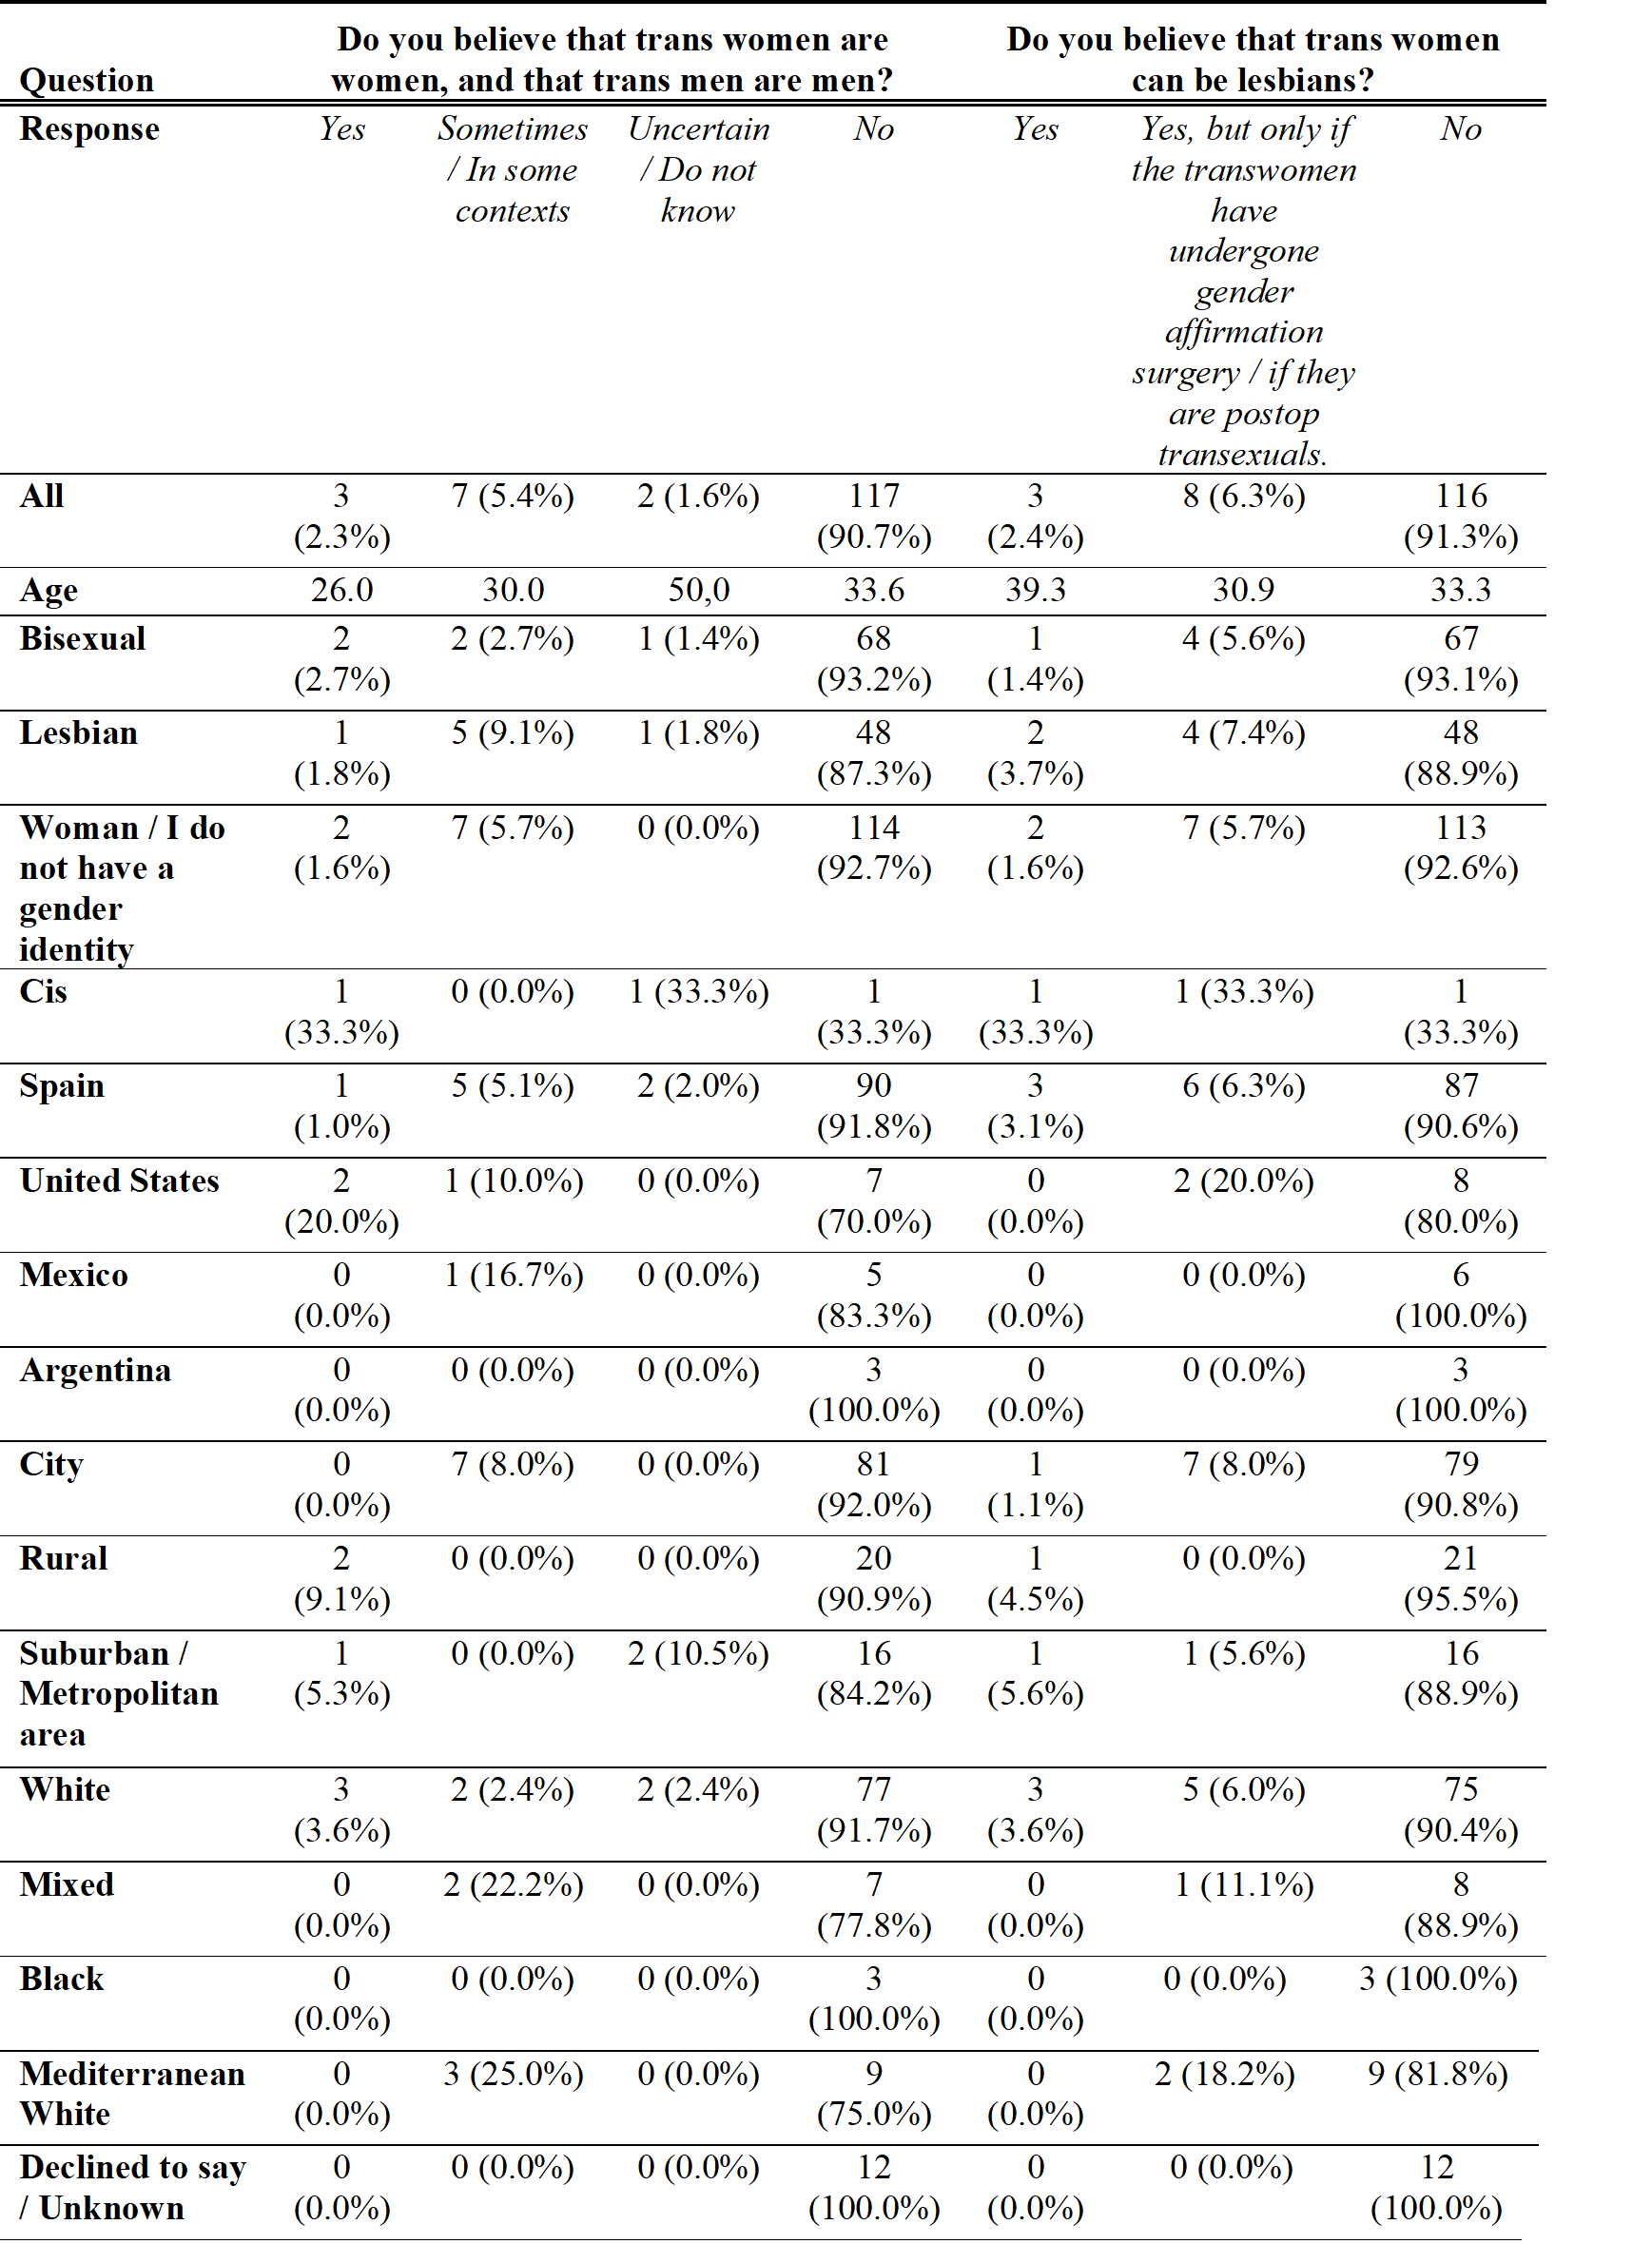
Table 3. Potential sexual partners
|
Question |
Who
would you consider for possible sexual partners? |
Would
you consider having sex with a transwoman? |
Would
you consider having sex with a trans man? |
|||||
|
Response |
Women,
or women and men / People who are not trans / Cis people |
Both
groups |
Yes |
Uncertain
/ Maybe |
No |
Yes |
Uncertain
/ Maybe |
No |
|
All |
114 (89.8%) |
13
(10.2%) |
4
(3.1%) |
10
(7.8%) |
114
(89.1%) |
19
(14.8%) |
32
(25.0%) |
77
(60.2%) |
|
Age |
33,7 |
30,4 |
28.5 |
34.4 |
33.6 |
27.1 |
33.0 |
35.4 |
|
Bisexual |
64
(87.7%) |
9
(12.3%) |
3
(4.2%) |
7
(9.7%) |
62
(86.1%) |
11
(15.3%) |
21
(29.2%) |
40
(55.6%) |
|
Lesbian |
49
(92.5%) |
4
(7.5%) |
1 (1.8%) |
3
(5.5%) |
51
(92.7%) |
8
(14.5%) |
11
(20.0%) |
36
(65.5%) |
|
Woman / I do not have a gender identity |
111
(90.2%) |
12
(9.8%) |
4
(3.3%) |
8
(6.6%) |
110
(90.2%) |
18
(14.8%) |
30
(24.6%) |
74
(60.7%) |
|
Cis |
1
(50.0%) |
1
(50.0%) |
0
(0.0%) |
1
(33.3%) |
2
(66.7%) |
0
(0.0%) |
1 (33.3%) |
2
(66.7%) |
|
Spain |
84
(87.5%) |
12
(12.5%) |
4
(4.1%) |
8
(8.2%) |
85
(87.6%) |
15
(15.5%) |
21
(21.6%) |
61
(62.9%) |
|
United States |
9
(90.0%) |
1
(10.0%) |
0
(0.0%) |
2
(20.0%) |
8
(80.0%) |
1
(10.0%) |
2
(20.0%) |
7
(70.0%) |
|
Mexico |
6
(100.0%) |
0
(0.0%) |
0
(0.0%) |
0
(0.0%) |
6 (100.0%) |
0
(0.0%) |
4
(66.7%) |
2
(33.3%) |
|
Argentina |
3
(100.0%) |
0
(0.0%) |
0
(0.0%) |
0
(0.0%) |
3
(100.0%) |
1
(33.3%) |
1
(33.3%) |
1
(33.3%) |
|
City |
79
(89.8%) |
9
(10.2%) |
3
(3.4%) |
8
(9.2%) |
76
(87.4%) |
12
(13.8%) |
23
(26.4%) |
52
(59.8%) |
|
Rural |
19
(90.5%) |
2
(9.5%) |
1 (4.5%) |
0
(0.0%) |
21
(95.5%) |
5
(22.7%) |
2
(9.1%) |
15
(68.2%) |
|
Suburban / Metropolitan area |
16
(88.9%) |
2
(11.1%) |
0
(0.0%) |
2
(10.5%) |
17
(89.5%) |
2
(10.5%) |
7
(36.8%) |
10
(52.6%) |
|
White |
72
(87.8%) |
10
(12.2%) |
3
(3.6%) |
7
(8.4%) |
73
(88.0%) |
14
(16.9%) |
19
(22.9%) |
50 (60.2%) |
|
Mixed |
8
(88.9%) |
1
(11.1%) |
1
(11.1%) |
0
(0.0%) |
8
(88.9%) |
2
(22.2%) |
2
(22.2%) |
5
(55.6%) |
|
Black |
3
(100.0%) |
0
(0.0%) |
0
(0.0%) |
1
(33.3%) |
2
(66.7%) |
1
(33.3%) |
2
(66.7%) |
0
(0.0%) |
|
Mediterranean White |
11
(91.7%) |
1
(8.3%) |
0
(0.0%) |
1
(8.3%) |
11
(91.7%) |
1 (8.3%) |
2
(16.7%) |
9
(75.0%) |
|
Declined to say / Unknown |
11
(91.7%) |
1
(8.3%) |
0
(0.0%) |
1
(8.3%) |
11
(91.7%) |
1
(8.3%) |
5
(41.7%) |
6
(50.0%) |
|
Latina / Hispanic |
8
(100.0%) |
0
(0.0%) |
0
(0.0%) |
0
(0.0%) |
8
(100.0%) |
0
(0.0%) |
2
(25.0%) |
6
(75.0%) |
|
Gitana |
1
(100.0%) |
0 (0.0%) |
0
(0.0%) |
0
(0.0%) |
1
(100.0%) |
0
(0.0%) |
0
(0.0%) |
1
(100.0%) |
The next axis of analysis involved sexual harassment online and sexual pressure offline. The studies tables related to this axis are below as Table 4 and Table 5. The first question related to sexual harassment online was, "Has any transwoman sexually harassed you online (made inappropriate comments, made inappropriate advances, sent you pornographic images, made derogatory comments about your sexuality, or harassed you online)?" 54.7% women answered yes to this question and 45.3% answered no. Bisexual women said they had been sexually harassed online at 45.8% with 65.5% of lesbians having said yes, they had been sexually harassed by transwomen online. American women were more likely to have been sexually harassed by transwomen online than their Spanish counterparts. Transmen are not sexually harassing lesbians and bisexual women online but 74.2% reported other groups of people, mostly men, were sexually harassing them online. They reported that men and transwomen sexually harassed lesbians in similar ways, including sending them dickpics and dickvids. Those lesbians reporting sexual harassment by transwomen also reported getting threats of sexual assault, threats of corrective rape, general threats of violence and getting sent pictures of child pornography. They were also called names like whore, bitch, slut, "koala porn", transphobe and told they were ugly. Dating apps were a particular place where lesbians got sexually harassed.
The study asked several questions related to pressure to have sex, with the first being, "Has a transwoman ever sexually pressured you or forced you to have sexual contact (genital touching, oral sex, anal sex, or vaginal sex) against your will or without your consent?" 18.1% of women responded yes with big discrepancies between groups. According to the study, “Bisexual women were much less likely than lesbian women to be sexually pressured, with a rate of 8.5% compared to 30.9%. 50.0% cis women reported being sexually pressured. 40.0% of women in the United States reported being sexually pressured by transwomen compared to 17.7% in Spain, 16.7% in Mexico and 33.3% in Argentina. Women in rural areas were least likely to be sexually pressured by transwomen at 14.3%, while 17.2% of women in cities and 26.3% of women in the suburbs reported being sexually pressured by transwomen.” A similar question was asked related to transmen with only two of 127 respondents answering yes.
Table 4. Online sexual harassment by offender type
|
Question |
Has any
transwoman sexually harassed you online (made inappropriate comments, made
inappropriate advances, sent you pornographic images, made derogatory
comments about your sexuality, or harassed you online)? |
Has any
transman sexually harassed you online? |
Have
you been sexually harassed online by any other type of person, including men,
women and non-binary or queer identifying people? |
|||
|
Response |
Yes |
No |
Yes |
No |
Yes |
No |
|
All |
70
(54.7%) |
58
(45.3%) |
3
(2.3%) |
125
(97.7%) |
95
(74.2%) |
33
(25.8%) |
|
Age |
33,6 |
33,4 |
24,7 |
33,7 |
32,55789474 |
36,2 |
|
Bisexual |
33
(45.8%) |
39
(54.2%) |
1
(1.4%) |
71
(98.6%) |
56
(77.8%) |
16
(22.2%) |
|
Lesbian |
36
(65.5%) |
19
(34.5%) |
2
(3.6%) |
53
(96.4%) |
38
(69.1%) |
17
(30.9%) |
|
Woman / I do not have a gender identity |
68
(55.3%) |
55
(44.7%) |
3
(2.4%) |
120 (97.6%) |
92
(74.8%) |
31
(25.2%) |
|
Cis |
1
(50.0%) |
1
(50.0%) |
0
(0.0%) |
2
(100.0%) |
1
(50.0%) |
1
(50.0%) |
|
Spain |
53
(54.6%) |
44
(45.4%) |
2
(2.1%) |
95
(97.9%) |
73
(75.3%) |
24
(24.7%) |
|
United States |
8
(80.0%) |
2
(20.0%) |
0
(0.0%) |
10
(100.0%) |
8
(80.0%) |
2
(20.0%) |
|
Mexico |
3
(50.0%) |
3
(50.0%) |
0
(0.0%) |
6
(100.0%) |
4
(66.7%) |
2
(33.3%) |
|
Argentina |
3
(100.0%) |
0
(0.0%) |
1
(33.3%) |
2
(66.7%) |
3
(100.0%) |
0
(0.0%) |
|
City |
51
(58.0%) |
37
(42.0%) |
2
(2.3%) |
86
(97.7%) |
65
(73.9%) |
23
(26.1%) |
|
Rural |
9
(42.9%) |
12
(57.1%) |
1
(4.8%) |
20 (95.2%) |
19
(90.5%) |
2
(9.5%) |
|
Suburban / Metropolitan area |
10
(52.6%) |
9
(47.4%) |
0
(0.0%) |
19
(100.0%) |
11
(57.9%) |
8
(42.1%) |
|
White |
44
(53.0%) |
39
(47.0%) |
3
(3.6%) |
80
(96.4%) |
58
(69.9%) |
25
(30.1%) |
|
Mixed |
2
(22.2%) |
7
(77.8%) |
0
(0.0%) |
9
(100.0%) |
8
(88.9%) |
1 (11.1%) |
|
Black |
1
(33.3%) |
2
(66.7%) |
0
(0.0%) |
3
(100.0%) |
1
(33.3%) |
2
(66.7%) |
|
Mediterranean White |
9
(75.0%) |
3
(25.0%) |
0
(0.0%) |
12
(100.0%) |
10
(83.3%) |
2
(16.7%) |
|
Declined to say / Unknown |
7
(58.3%) |
5
(41.7%) |
0
(0.0%) |
12
(100.0%) |
10
(83.3%) |
2
(16.7%) |
|
Latina / Hispanic |
6
(75.0%) |
2
(25.0%) |
0
(0.0%) |
8
(100.0%) |
7
(87.5%) |
1
(12.5%) |
|
Gitana |
1
(100.0%) |
0
(0.0%) |
0
(0.0%) |
1
(100.0%) |
1
(100.0%) |
0
(0.0%) |
|
I have not visited online dating sites |
14
(38.9%) |
22
(61.1%) |
2
(5.6%) |
34
(94.4%) |
25
(69.4%) |
11
(30.6%) |
|
Use dating site |
55
(61.8%) |
34
(38.2%) |
1
(1.1%) |
88
(98.9%) |
68
(76.4%) |
21
(23.6%) |
Table 5. Non-consensual sexual contact by perpetrator type
|
Question |
Has a
transwoman ever sexually pressured you or forced you to have sexual contact
(genital touching, oral sex, anal sex, or vaginal sex) against your will or
without your consent? |
Has a
transman ever sexually pressured you or forced you to have sexual contact
against your will or without your consent? |
Has any
other member of the LGTB collective, including other lesbians, non-binary
people, bisexuals, people with intersex conditions, ever sexually pressured
you or forced you to have sexual contact against your will or without your
consent? |
Has a
man ever sexually pressured you or forced you to have sexual contact against
your will or without your consent? |
||||
|
Response |
Yes |
No |
Yes |
No |
Yes |
No |
Yes |
No |
|
All |
23
(18.1%) |
104
(81.9%) |
2
(1.6%) |
125
(98.4%) |
29 (23.0%) |
97
(77.0%) |
109
(85.2%) |
19
(14.8%) |
|
Age |
34,0 |
33,4 |
31,0 |
33,5 |
34,137931 |
33,2 |
34,2 |
29,7 |
|
Bisexual |
6
(8.5%) |
65
(91.5%) |
1
(1.4%) |
71
(98.6%) |
15
(21.1%) |
56
(78.9%) |
63
(87.5%) |
9
(12.5%) |
|
Lesbian |
17
(30.9%) |
38
(69.1%) |
1
(1.9%) |
53
(98.1%) |
14
(25.9%) |
40 (74.1%) |
45
(81.8%) |
10
(18.2%) |
|
Woman / I do not have a gender identity |
21
(17.2%) |
101
(82.8%) |
2
(1.6%) |
120
(98.4%) |
27
(22.3%) |
94
(77.7%) |
105
(85.4%) |
18
(14.6%) |
|
Cis |
1
(50.0%) |
1
(50.0%) |
0
(0.0%) |
2
(100.0%) |
1
(50.0%) |
1
(50.0%) |
2
(100.0%) |
0
(0.0%) |
|
Spain |
17 (17.7%) |
79
(82.3%) |
2
(2.1%) |
94
(97.9%) |
24
(25.3%) |
71
(74.7%) |
84
(86.6%) |
13
(13.4%) |
|
United States |
4
(40.0%) |
6
(60.0%) |
0
(0.0%) |
10
(100.0%) |
2
(20.0%) |
8
(80.0%) |
10
(100.0%) |
0
(0.0%) |
|
Mexico |
1
(16.7%) |
5
(83.3%) |
0
(0.0%) |
6
(100.0%) |
2
(33.3%) |
4
(66.7%) |
4 (66.7%) |
2
(33.3%) |
|
Argentina |
1
(33.3%) |
2
(66.7%) |
0
(0.0%) |
3
(100.0%) |
1
(33.3%) |
2
(66.7%) |
3
(100.0%) |
0
(0.0%) |
|
City |
15
(17.2%) |
72
(82.8%) |
1
(1.1%) |
86
(98.9%) |
20
(23.3%) |
66
(76.7%) |
73
(83.0%) |
15
(17.0%) |
|
Rural |
3
(14.3%) |
18
(85.7%) |
1
(4.8%) |
20
(95.2%) |
3 (14.3%) |
18
(85.7%) |
21
(100.0%) |
0
(0.0%) |
|
Suburban / Metropolitan area |
5
(26.3%) |
14
(73.7%) |
0
(0.0%) |
19
(100.0%) |
6
(31.6%) |
13
(68.4%) |
15
(78.9%) |
4
(21.1%) |
|
White |
17
(20.7%) |
65
(79.3%) |
1
(1.2%) |
81
(98.8%) |
21
(25.9%) |
60
(74.1%) |
72
(86.7%) |
11
(13.3%) |
|
Mixed |
0
(0.0%) |
9
(100.0%) |
0
(0.0%) |
9
(100.0%) |
0
(0.0%) |
9
(100.0%) |
8
(88.9%) |
1
(11.1%) |
|
Black |
1
(33.3%) |
2
(66.7%) |
0
(0.0%) |
3
(100.0%) |
1
(33.3%) |
2
(66.7%) |
2
(66.7%) |
1
(33.3%) |
|
Mediterranean White |
2
(16.7%) |
10
(83.3%) |
0
(0.0%) |
12
(100.0%) |
1
(8.3%) |
11 (91.7%) |
9
(75.0%) |
3
(25.0%) |
|
Declined to say / Unknown |
3
(25.0%) |
9
(75.0%) |
0
(0.0%) |
12
(100.0%) |
4
(33.3%) |
8
(66.7%) |
10
(83.3%) |
2
(16.7%) |
|
Latina / Hispanic |
0
(0.0%) |
8
(100.0%) |
1
(12.5%) |
7
(87.5%) |
2
(25.0%) |
6
(75.0%) |
7
(87.5%) |
1
(12.5%) |
|
Gitana |
0 (0.0%) |
1
(100.0%) |
0
(0.0%) |
1
(100.0%) |
0
(0.0%) |
1
(100.0%) |
1
(100.0%) |
0
(0.0%) |
|
I have not visited online dating sites |
5
(13.9%) |
31
(86.1%) |
0
(0.0%) |
36
(100.0%) |
7
(19.4%) |
29
(80.6%) |
26
(72.2%) |
10
(27.8%) |
|
Use dating site |
18
(20.5%) |
70
(79.5%) |
2
(2.3%) |
86 (97.7%) |
22
(25.3%) |
65
(74.7%) |
80
(89.9%) |
9
(10.1%) |
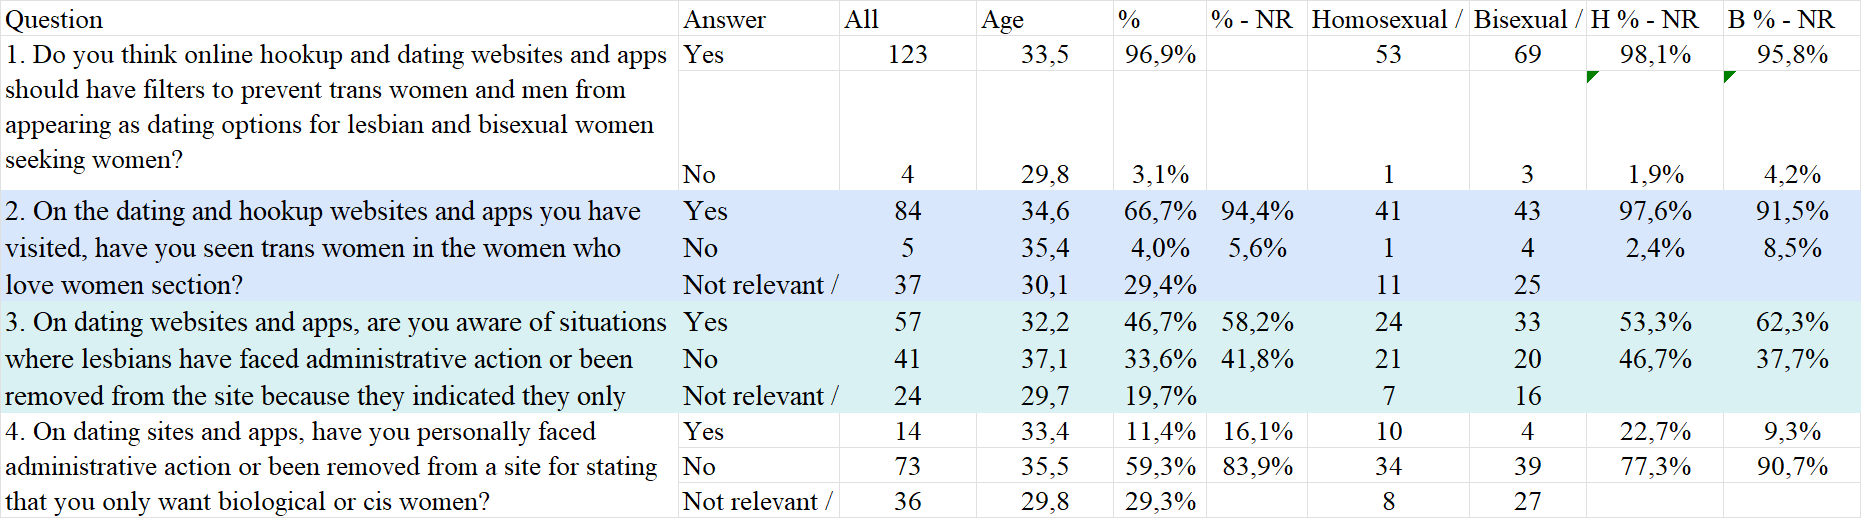
The fourth axis of analysis was about online dating. See Table 6 below. 96.9% of women said they believed online dating apps for women seeking women should exclude men / those with penises. The study summarized these women’s thoughts, “Answers tended to fall into several broad categories along the lines of “lesbians and bisexual women should be allowed to have their sexuality respected with specific spaces for them,” that gender identity should not be prioritized over sexual orientation, that women need to be protected against men, that women should be allowed spaces free from male abuse, and that women should be allowed to have spaces that are free of male sexual fetishism. The exact phrase "lesbians do not have penises" was used five times.“ Of those using dating apps, 94.4% said they had seen trans women on women-only dating apps and 5.6% had not. Among the dating apps used by these women, only Edarling was listed with women not seeing transwomen on it. Badoo, Bumble, eHarmony, Facebook groups, Happn, Her, Meetic, OKCupid, Pof, Tinder, Ulindr, Wapa and WhatsApp groups were all reported as having transwomen in women-only dating sections. 46.7% women said they were aware of other women being administratively punished on these women-only dating sites for expressing interest in only biological women. 16.0% of women who used online dating apps reported having administrative action taken against them on such a site for expressing a desire to date only women on the site.
Table 6. Online dating sites
The last axis of analysis involved sex and the topic of consent. See Table 7 and Table 8. One set of questions dealt with the topic of consent. The other dealt with the police. Overall, women responding to the survey did not believe that LGTB community discussed the topic of sexual consent enough, nor that the lesbian and bisexual women community discussed it enough. On the other hand, they did believe that feminists discussed it enough, though they were critical of the question because they did not believe the discussion should be framed around consent but mutual desire. Women wanted organizations and the government to provide additional information on how consent works between women.
The study found that respondents did not think, because of their sexual orientation, the police would believe them if they reported non-consensual sexual contact, with 18.3% of bisexual women thinking the police would believe them compared to 22.6% of lesbians thinking the police would believe them. The survey sought to understand if the person engaging in the non-consensual sexual contact was a transwoman, if women thought this would change their answer to the previous question. Written responses indicated that for many, it would. Some women said that they believed the police would be less likely to believe a transwoman could be a rapist and that the police might in turn accuse them of being transphobes.
Table 7. Women who believe groups discuss sexual consent enough and want more information about sexual consent
|
Question |
Do you think that the issue of sexual consent
is sufficiently discussed by lesbian and bisexual women community? |
Do you think that the subject of sexual
consent is talked about enough in the LGTB / LGBTTT / LGBTQI+ community? |
Do you think that the topic of sexual consent
is discussed enough in the feminist community? |
Do you want more information from the
government and other organizations about sexual consent in relation to
relationships between women? |
||||
|
Answer |
Yes |
No |
Yes |
No |
Yes |
No |
Yes |
No |
|
Total |
35
(27.3%) |
93
(72.7%) |
11
(8.7%) |
115
(91.3%) |
105
(82.0%) |
23
(18.0%) |
67
(53.6%) |
58
(46.4%) |
|
Age |
33,8286 |
33,24731 |
35,8182 |
33,3739 |
33,3429 |
33,6957 |
31,68657 |
35,069 |
|
Bisexual |
20
(27.4%) |
53
(72.6%) |
7
(9.9%) |
64
(90.1%) |
62
(84.9%) |
11
(15.1%) |
38
(52.8%) |
34
(47.2%) |
|
Lesbian |
15
(27.8%) |
39
(72.2%) |
4
(7.4%) |
50
(92.6%) |
43
(79.6%) |
11
(20.4%) |
(53.8%) |
24
(46.2%) |
|
Woman / I do not have a gender identity |
32
(26.2%) |
90 (73.8%) |
11
(9.2%) |
109
(90.8%) |
99
(81.1%) |
23
(18.9%) |
64
(53.3%) |
56
(46.7%) |
|
Cis |
1
(33.3%) |
2
(66.7%) |
0
(0.0%) |
3
(100.0%) |
3
(100.0%) |
0
(0.0%) |
2
(100.0%) |
0
(0.0%) |
|
Spain |
26
(26.8%) |
71
(73.2%) |
8
(8.4%) |
87
(91.6%) |
80
(82.5%) |
17
(17.5%) |
49
(52.1%) |
45 (47.9%) |
|
United States |
4
(40.0%) |
6
(60.0%) |
3
(30.0%) |
7
(70.0%) |
8
(80.0%) |
2
(20.0%) |
4
(40.0%) |
6
(60.0%) |
|
Mexico |
2
(33.3%) |
4
(66.7%) |
0
(0.0%) |
6
(100.0%) |
5
(83.3%) |
1
(16.7%) |
4
(66.7%) |
2
(33.3%) |
|
Argentina |
1
(33.3%) |
2
(66.7%) |
0
(0.0%) |
3
(100.0%) |
1 (33.3%) |
2
(66.7%) |
2
(66.7%) |
1
(33.3%) |
|
City |
22
(25.3%) |
65
(74.7%) |
6
(7.0%) |
80
(93.0%) |
72
(82.8%) |
15
(17.2%) |
48
(55.8%) |
38
(44.2%) |
|
Rural |
7
(31.8%) |
15
(68.2%) |
0
(0.0%) |
21
(100.0%) |
17
(77.3%) |
5
(22.7%) |
10
(47.6%) |
11
(52.4%) |
|
Suburban / Metropolitan area |
6
(31.6%) |
13
(68.4%) |
5
(26.3%) |
14
(73.7%) |
16
(84.2%) |
3
(15.8%) |
9
(50.0%) |
9
(50.0%) |
|
White |
29
(34.9%) |
54
(65.1%) |
8
(9.8%) |
74
(90.2%) |
72
(86.7%) |
11
(13.3%) |
42
(52.5%) |
38
(47.5%) |
|
Mixed |
1
(11.1%) |
8
(100.0%) |
0
(0.0%) |
8
(100.0%) |
7 (77.8%) |
2
(22.2%) |
7
(77.8%) |
2
(22.2%) |
|
Black |
1
(33.3%) |
2
(66.7%) |
0
(0.0%) |
3
(100.0%) |
3
(100.0%) |
0
(0.0%) |
1
(33.3%) |
2
(66.7%) |
|
Mediterranean White |
3
(25.0%) |
9
(75.0%) |
0
(0.0%) |
12
(100.0%) |
6
(50.0%) |
6
(50.0%) |
7
(58.3%) |
5
(41.7%) |
|
Declined to say / Unknown |
0
(0.0%) |
12
(100.0%) |
1
(8.3%) |
11
(91.7%) |
10
(83.3%) |
2
(16.7%) |
5
(41.7%) |
7
(58.3%) |
|
Latina / Hispanic |
1
(12.5%) |
7
(87.5%) |
2
(25.0%) |
6
(91.7%) |
6
(75.0%) |
2
(25.0%) |
4
(50.0%) |
4
(50.0%) |
|
Gitana |
0
(0.0%) |
1
(100.0%) |
0
(0.0%) |
1
(100.0%) |
1
(100.0%) |
0 (0.0%) |
1
(100.0%) |
0
(0.0%) |
|
I have not visited online dating or hookup
sites |
12
(30.0%) |
28
(70.0%) |
3
(7.5%) |
37
(92.5%) |
32
(80.0%) |
8
(20.0%) |
23
(62.2%) |
14
(37.8%) |
|
Use dating site |
23
(26.1%) |
65
(73.9%) |
8
(9.3%) |
78
(90.7%) |
73
(83.0%) |
15
(17.0%) |
44 (50.0%) |
44
(50.0%) |
Table 9. Women who love women who think the police would believe reports of sexual abuse
|
Question |
As a woman who loves women, do you think the
police and other reporting authorities would believe you if you reported
non-consensual sexual contact? |
Would your answer to the previous question
change depending on who was the perpetrator of the non-consensual sexual
activity? For example, if the perpetrator were a man, a woman, a transgender
man, or a transgender woman, do you think you would be more likely to report
the non-consensual sexual contact to the police? |
||
|
Answer |
Yes |
No |
Yes |
No |
|
Total |
25
(20.0%) |
100
(80.0%) |
56
(45.9%) |
66
(54.1%) |
|
Age |
37,0 |
32,7 |
33,5 |
34,1 |
|
Bisexual |
13
(18.3%) |
58
(81.7%) |
33
(45.8%) |
39
(54.2%) |
|
Lesbian |
12
(22.6%) |
41
(77.4%) |
23 (46.9%) |
26
(53.1%) |
|
Woman / I do not have a gender identity |
23
(19.3%) |
96
(80.7%) |
56
(48.3%) |
60
(51.7%) |
|
Cis |
1
(33.3%) |
2 (66.7%) |
0
(0.0%) |
3
(100.0%) |
|
Spain |
18
(18.9%) |
77
(81.1%) |
40
(43.0%) |
53
(57.0%) |
|
United States |
5
(50.0%) |
5
(50.0%) |
5
(50.0%) |
5 (50.0%) |
|
Mexico |
0
(0.0%) |
6
(100.0%) |
3
(50.0%) |
3
(50.0%) |
|
Argentina |
1
(33.3%) |
2
(66.7%) |
2
(100.0%) |
0
(0.0%) |
|
City |
16
(18.8%) |
69
(81.2%) |
37
(44.6%) |
46
(55.4%) |
|
Rural |
5
(23.8%) |
16
(76.2%) |
10
(50.0%) |
10
(50.0%) |
|
Suburban / Metropolitan area |
4
(21.1%) |
15 (78.9%) |
9
(47.4%) |
10
(52.6%) |
|
White |
20
(24.7%) |
61
(75.3%) |
37
(46.3%) |
43
(53.8%) |
|
Mixed |
1
(12.5%) |
7
(87.5%) |
3
(37.5%) |
5
(62.5%) |
|
Black |
0
(0.0%) |
3
(100.0%) |
2
(66.7%) |
1
(33.3%) |
|
Mediterranean White |
2
(16.7%) |
10
(83.3%) |
4
(36.4%) |
7
(63.6%) |
|
Declined to say / Unknown |
1
(8.3%) |
11
(91.7%) |
6
(54.5%) |
5
(45.5%) |
|
Latina / Hispanic |
1
(12.5%) |
7
(87.5%) |
3
(37.5%) |
5
(62.5%) |
|
Gitana |
0
(0.0%) |
1
(100.0%) |
1
(100.0%) |
0
(0.0%) |
|
Not relevant / I have not visited online
dating or hookup sites |
8
(20.5%) |
31
(79.5%) |
16 (43.2%) |
21
(56.8%) |
|
Use dating sites |
17
(19.8%) |
69
(80.2%) |
40
(47.1%) |
45
(52.9%) |
The discussion draws together the existing body of research about Spanish speaking lesbian and bisexual women and contextualizes it against the survey results. It says in part, “Lesbian and bisexual women repeatedly talked in the survey about a specific need as women who were sexually attracted to women, and that in order to feel safe and have the ability to communicate freely, they need spaces free of men, where they included transwomen as men”. The paper also says, “The survey findings confirm earlier research points about sexual consent being an issue, particularly within the LGTB community and how positioning regarding transwomen's sexual activities erodes the ability of women to consent, and effectively silences women. The survey findings also confirm that lesbian and bisexual women face barriers when it comes to potentially reporting sexual abuse. The survey goes further than a lot of available research in that it specifically finds that lesbians and bisexual women would be less likely to report transwomen who are sexual abusers out of fear of not being believed or fear of being accused of the police accusing the women of transphobia.”
The survey concludes by talking about the policy implications related to this study, especially as it relates to laws related to violence against women, and the need to develop strategies to insure the safety of bisexual and lesbian women from male violence specifically because of their sexual orientation.
Enter your email below to sign in or become a 4W member and join the conversation.
(Already did this? Try refreshing the page!)
Comments